Restaurant Operations Analysis
Restaurant Group, London
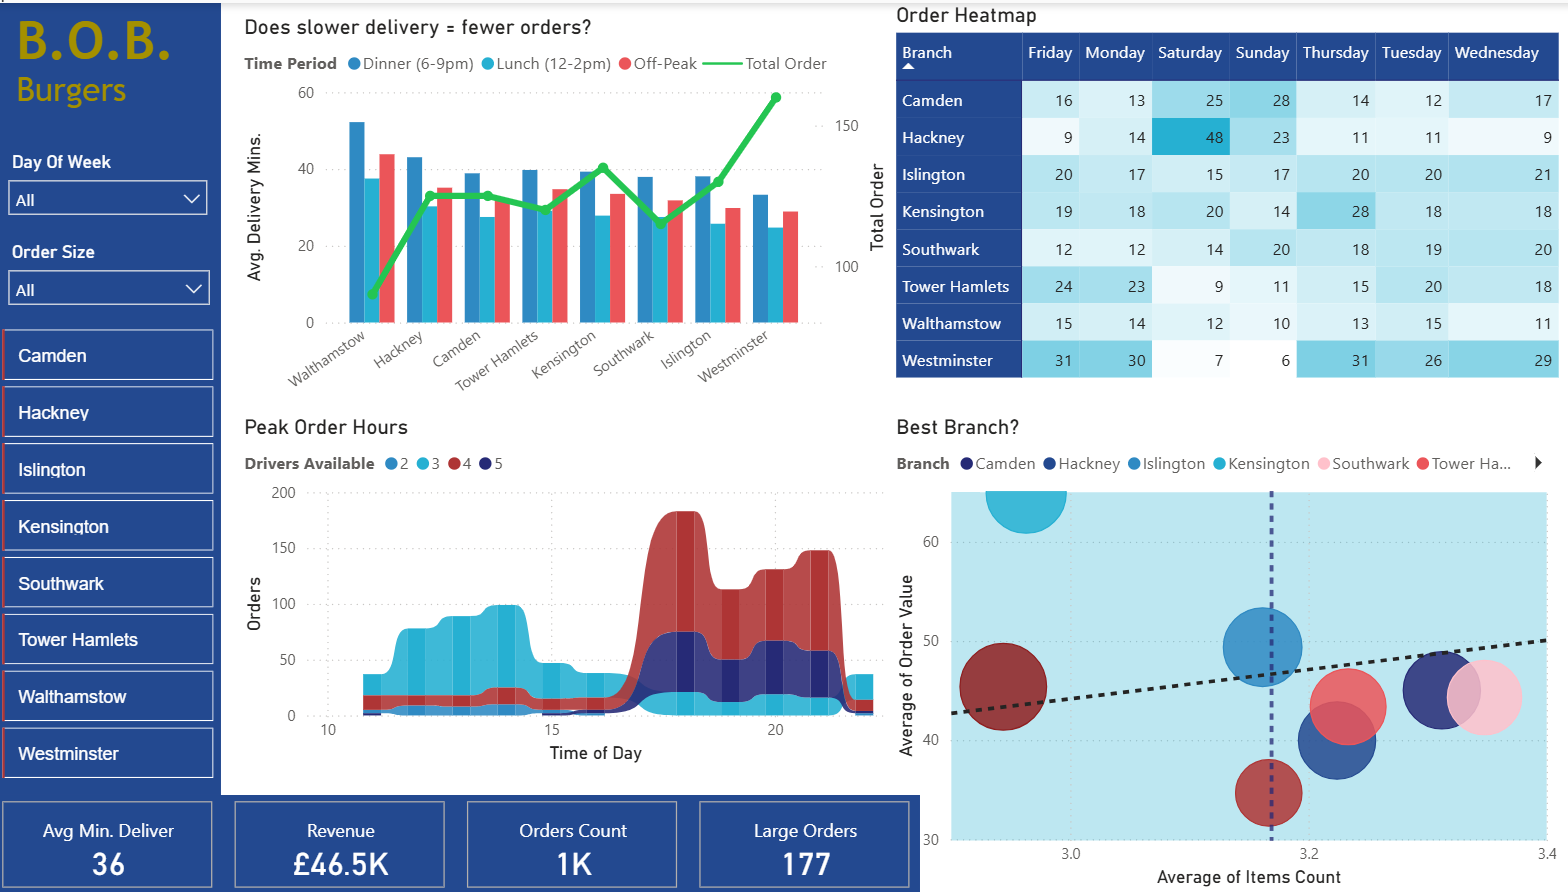
Context & Objective
The only brief received was a single line in an Excel file that said, 'Find us something useful.' With just five columns available and no additional context, the challenge was to define the right questions, engineer meaningful metrics, and turn sparse data into actionable business insight.
Challenges Faced
Lack of Direction
The client provided no context or objectives beyond 'find something useful.' This required independent framing of analytical goals before any modelling could begin.
Limited Data Availability
With only five columns of information, traditional analysis techniques were not viable. Each metric had to extract maximum insight from minimal input.
Complex Operational Interactions
Delivery times, order values, and branch locations influenced one another in non-linear ways, demanding calculated columns and logical groupings.
Approach & Solution
Metric-First Analysis
Established essential KPIs from available fields - delivery efficiency, driver utilisation, and order density - before designing any visuals.
Data Enrichment with DAX
Created calculated columns and measures to classify orders by distance, time slot, and branch performance. Ratio-based DAX logic highlighted variations.
Visual Modelling & Insight Delivery
Power BI dashboard revealing operational bottlenecks and revenue opportunities with interactive views for time, geography, and performance.
Results & Impact
- Modelled 5,200/month improvement opportunity from operational optimisations
- Demonstrated how clean logic extracts maximum value from minimal data
- Showcased analytical independence - framing questions and delivering results without direction